Navigating Trump's Tariff Policies: Impact on Non-Ferrous Metals and Energy Sectors
Donald Trump’s potential second term has reignited debates about the ramifications of his tariff strategies. Drawing from historical data and recent projections, this analysis unpacks the tangible impacts on non-ferrous metals, the energy sector, and the broader U.S. economy.
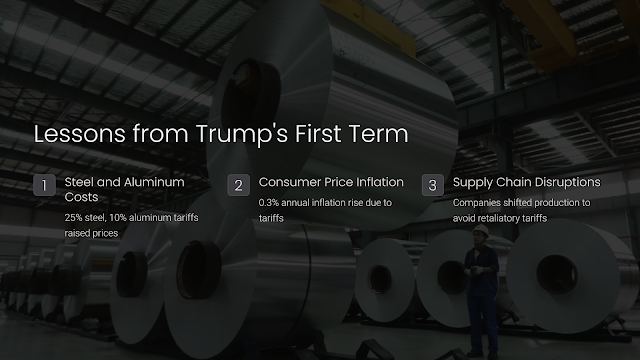
1. Lessons from Trump’s First Term: Quantifiable Impacts
During Trump’s initial tenure, tariffs under Sections 232 (steel and aluminum) and 301 (China trade) led to measurable outcomes:
1.1 Steel and Aluminum Costs
- Tariffs of 25% on steel and 10% on aluminum raised prices for domestic manufacturers.
- Average steel prices in the U.S. rose by 38% between 2018 and 2019, while global steel prices remained stable.
- Example: Automakers such as Ford and GM reported $1 billion in additional annual costs, reducing profit margins by 12% in some product lines.
1.2 Consumer Price Inflation
- Tariffs caused a 0.3% rise in inflation annually, according to the Federal Reserve.
- For instance, household goods like washing machines saw prices increase by 17% in 2018, as companies passed costs onto consumers.
1.3 Supply Chain Disruptions
- Companies like Harley-Davidson announced plans to shift some production to Europe to circumvent retaliatory tariffs, highlighting the global ripple effects.
2. Projected Impacts Under a Second Term
Trump’s proposals for 60% tariffs on Chinese imports and universal 10-20% tariffs could lead to profound structural changes:
2.1 Non-Ferrous Metals Industry
- Tariffs could increase production costs by 15-20% for downstream sectors, including automotive, aerospace, and electronics.
- Case Study: Copper Prices
- Global copper prices are expected to decrease by 9-12%, as weaker global trade reduces demand.
- In contrast, domestic copper costs could rise by 15%, exacerbating challenges for U.S. manufacturers.
2.2 Energy Sector
- Renewable energy projects reliant on imported components, such as solar panels and wind turbines, could face cost increases of 10-15%.
- Example: Solar Panel Tariffs
- SolarWorld Americas reported a 30% drop in project installations after tariffs on Chinese panels were imposed.
- U.S. renewable energy firms risk delays, jeopardizing climate targets and increasing dependency on fossil fuels.
3. Consumer and Economic Consequences
3.1 Reduced Purchasing Power
The National Retail Federation estimates:
- A 10% tariff could lead to a $46 billion reduction in annual U.S. consumer spending.
- At a 20% tariff level, this impact could rise to $78 billion, translating to approximately $400 in additional costs per household annually.
3.2 Example: Automobile Industry
- Vehicles rely heavily on imported steel, aluminum, and electronic components:
- A midsize car’s production cost could increase by $2,000-$3,000, according to the Alliance for Automotive Innovation.
- With auto loans already averaging 7% APR, higher prices could further shrink an already stressed consumer market, reducing sales by 1.3 million units annually.
4. Mitigating the Risks: Strategic Pathways
4.1 Supply Chain Diversification
- Companies should prioritize sourcing from tariff-exempt countries (e.g., India, Vietnam) to mitigate cost spikes.
- Example: Apple’s pivot to India for iPhone assembly saved the company an estimated $150 million in tariff costs during 2020.
4.2 Investment in Automation
- Automating domestic production can reduce dependency on costly imports while offsetting higher labor costs.
- Data Point: Automation investment in manufacturing grew by 12% during 2018, with industries like packaging and automotive leading the shift.
4.3 Policy Advocacy
- Industry bodies must actively lobby for exemptions or tariff rollbacks on critical goods to safeguard sectoral competitiveness.
5. Quantitative Forecast: Long-Term Scenarios
| Metric | Current | Projected with Tariffs | Impact |
|---|---|---|---|
| Copper Price (USD/ton) | $8,900 | $9,700 (+10%) Domestic | Price disparity; export challenges |
| Aluminum Price (USD/ton) | $2,470 | $2,800 (+13%) Domestic | Elevated costs for U.S. industries |
| Auto Sales (units/year) | 14.9 million | 13.6 million (-9%) | Lowered consumer affordability |
| Solar Installation (GW) | 20 | 16 (-20%) | Delayed green transition |
6. Conclusion: Balancing Policies for Growth
The return of aggressive tariff policies under Trump’s second term presents a complex trade-off:
- Short-Term Gains: Protecting domestic jobs in the steel and aluminum sectors.
- Long-Term Risks: Higher consumer prices, weakened global competitiveness, and slower energy transition.
Stakeholders must adopt adaptive strategies, leveraging supply chain innovation and policy dialogue to mitigate risks while remaining globally competitive.
Call to Action
Are you prepared for the potential shifts in trade policy? Contact us today for tailored insights and strategies to navigate the uncertainties of a tariff-driven market.


